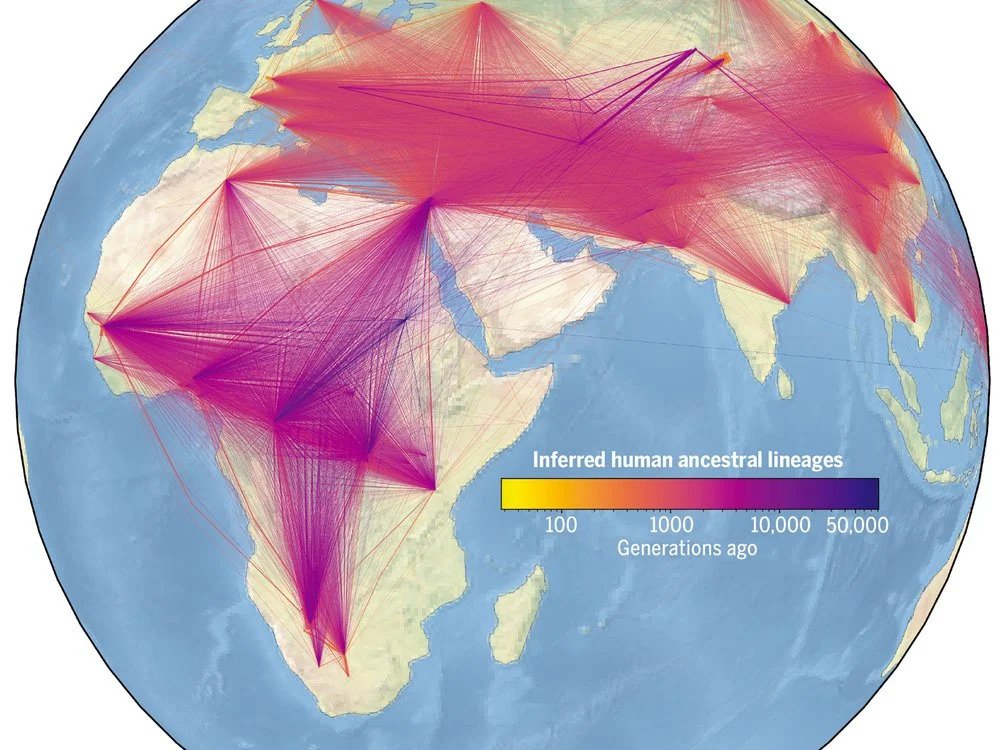
A visualization showing the inferred human ancestral lineages over time and geographical location. Each line represents an ancestral relationship; the line’s width shows the frequency of the relationship. Colour indicates the estimated age of the ancestor. Image: Reproduced, with permission, from Wohns et al., A unified genealogy of modern and ancient genomes. Science (2022).